AlphaWeave : Weaving your ideas and signals into a path of success.
Forum for Idea Weaving
By seamlessly interweaving the intricate threads of your unique ideas and the subtle signals, together we catch the ephemeral alpha fireflies.
Try for free no credit card required.


Core Features of AlphaWeave
AlphaWeave contains multiple analysis tools to help in building our trading signals. It is also a vibrant community for discussing the signals, personal finance and risk management
Crafted for Analysis
AlphaWeave contains multitude of analysis to help build your signals and craft your own Alpha
Multi Frame Analysis
AlphaWeave allows you to perform analysis on multiple time frames thereby uncovering hidden alpha gems
Python Underhood
AlphaWeave uses python for quick prototyping and analysis of signals
Risk Management Analysis
One of the most important reason of failure is not having any risk maangement strategy which wipes out our capital.At AlphaWeave Risk Management is the starting point rather than the signal analysis
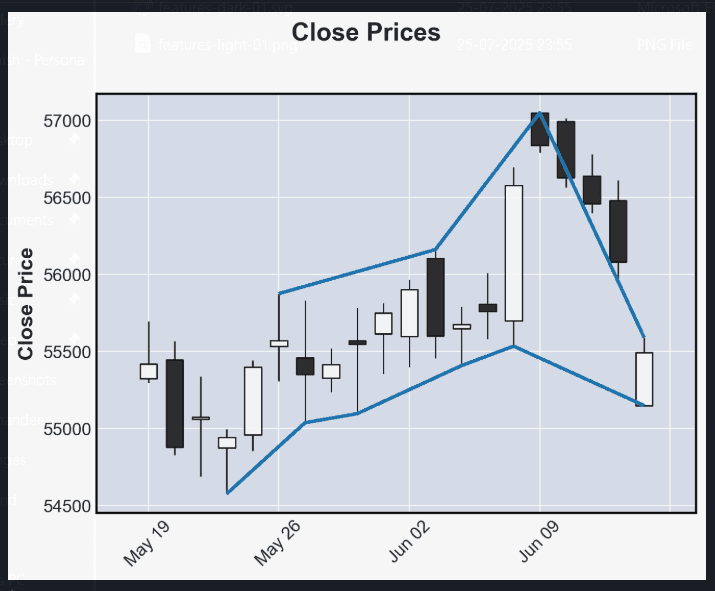
Auto Support and Resistance
AlphaWeave calculates Support and Resistance in real time using multiple analysis methods which the user can weave together
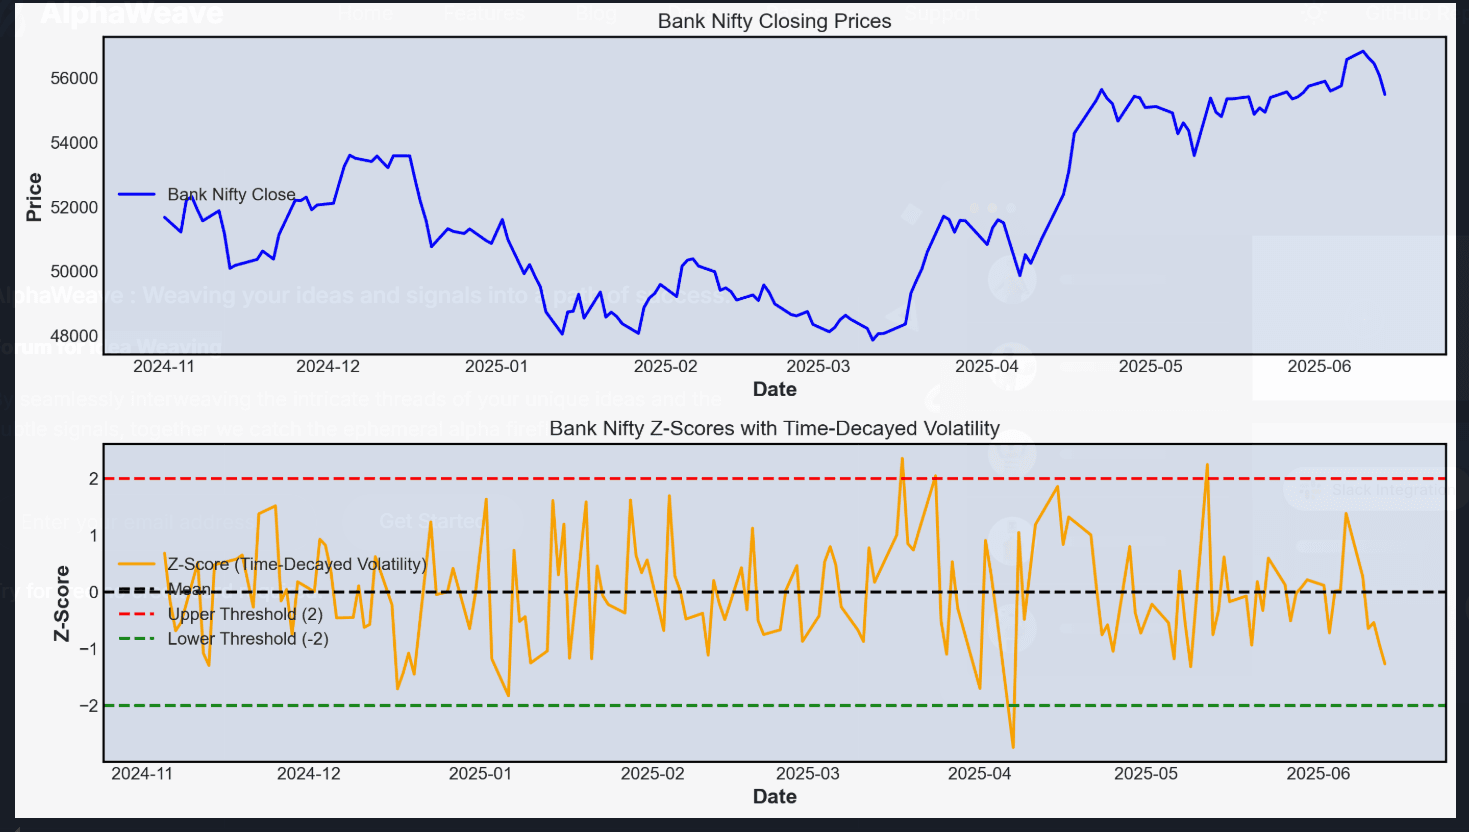
Real Time Analysis
AlphaWeave allows you to perform real time analysis of your signals
A Complete Solution forAlpha Buildup
At AlphaWeave we present to you the best analysis for index options, stocks, commodities and even for your personal finance.
Python
Realtime Fast Analysis.
Spark Agent
Your guide to building real-time data pipelines.
Launchpad for your Alpha Ideas
Packed with All Essential Integrations
AlphaWeave contains multiple analysis of the market and provides you with the best tools to build your alpha.


AlphaWeave provides real time analysis of signals.
The real time analysis of signals helps in course correction for our Alpha
The analysis can be run multiple times to get the most recent data
The analysis is also available at multiple time frames
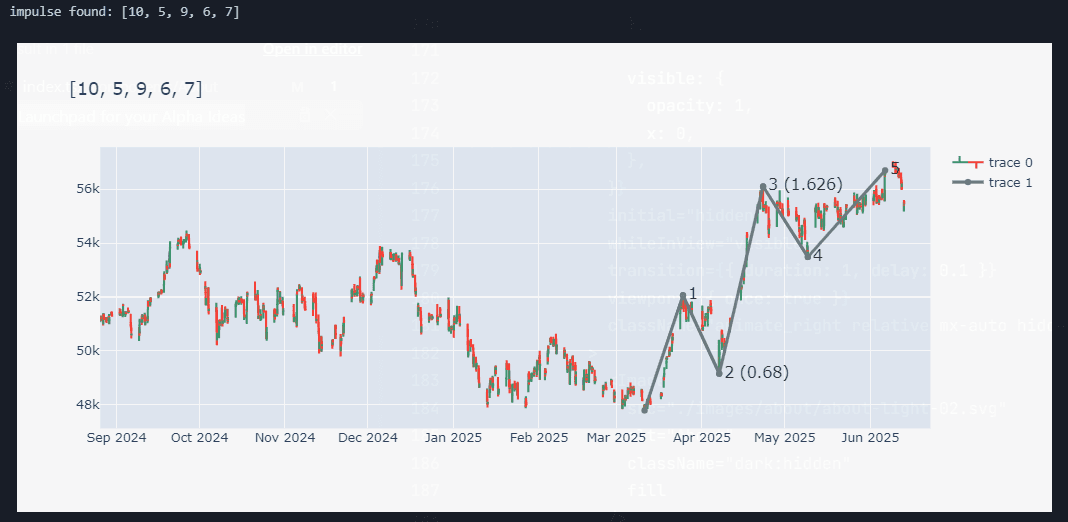
Many a times, the signals travel across time frame giving a glimpse into the future.
Multi-frame analysis helps in tracking such signals.
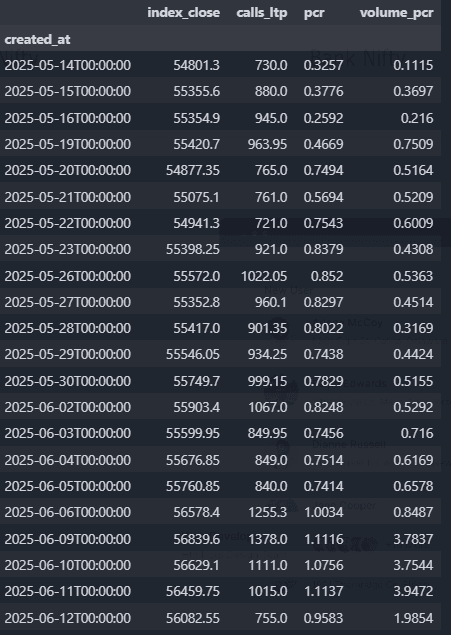
Option Chains are a storehouse of information
The option chains provides for multiple signals and their confirmation
The chain analysis can also be done in realtime to adjust the signal


Weave Your Alpha towards Success!!
At AlphaWeave, together we analyse the signals and weave them into the ephemeral Alpha Fireflies. Its also a place for personal finance discussions and improvements.
50
Analysis
100
Datasets
86
Users
Connect to your broker, bank and independent analysis.
You can connect your data stream and any broker or financial institution of your choice.


Join With Us Today On the Path to Weave a New Alpha !
Dozens of signals and their analysis together will help us to weave together Alpha, not only in our trading and investment but also in our personal finance.

To start with we have provided analysis on Nifty and Bank Nifty but the methods are generic and can be applied to any dataset.
Latest News & Blogs
Follow the latest news and blogs in Personal Finance and Signal Analysis
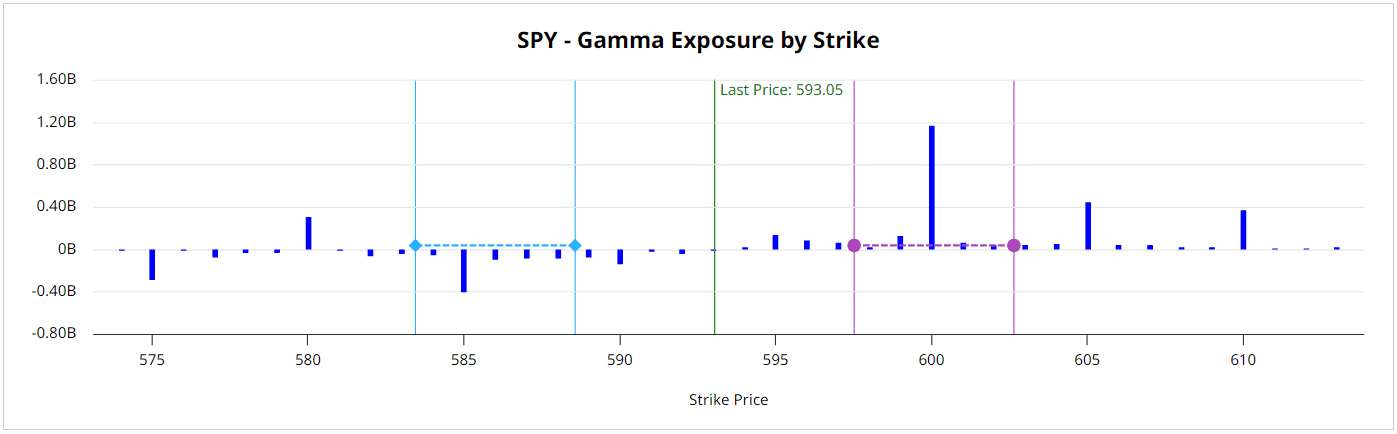
Gamma Exposure: Predicting Explosive Sto...
Gamma Exposure (also known as GEX) is one of the most powerful and underrated tools for options traders. If you want to understand how major price levels form — and how to trade around volatility — this is essential information.
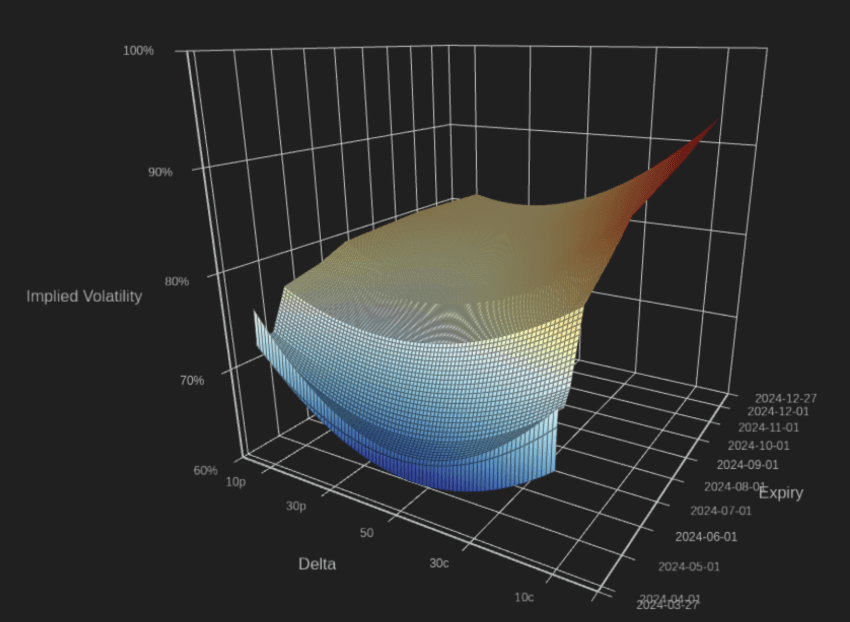
Constructing a Volatility Surface...
A volatility surface maps out how implied volatility (IV) changes across different option strikes or deltas and expiration times, offering a three-dimensional view of the market’s expectation of future volatility. Constructing a volatility surface goes beyond merely collecting option prices and calculating IV’s. It involves selecting appropriate models, ensuring data integrity, selecting reasonable filters, and constantly updating to incorporate the latest market conditions.
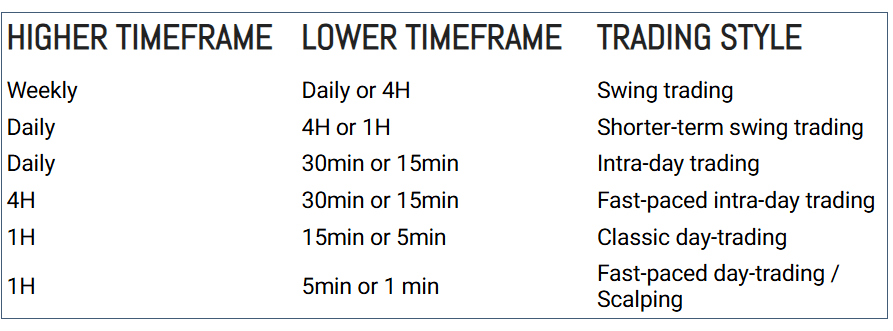
Multi Frame Analysis...
Multi-timeframe trading describes a trading approach where the trader combines different trading timeframes to improve decision-making and optimize their chart analyses.